Second Quarter 2024 CIO Letter: There Is No Free Lunch
Central Banks face complex decisions regarding inflation, economic growth, and financial stability in the post-pandemic economic landscape.
Government spending has significantly contributed to GDP and employment growth but has also led to a high U.S. budget deficit.
The convergence of slowing demographic growth, deglobalization, and massive debt accumulation may further slow future potential GDP growth.
The forty-year era of falling bond yields has likely ended, signaling a shift in the economic landscape with higher interest rates and increased borrowing costs.
The market is expensive, even when removing the impact of the largest capitalization names from the benchmark.
Navigating post-pandemic economic uncertainty remains complex as Central Banks grapple with tough decisions regarding inflation, economic growth, and financial stability. This uncertainty, compounded by geopolitical tensions and global elections, broadens the range of possible outcomes and increases the risk of policy errors and economic missteps.
In environments where Central Bank goals conflict, financial stability and the economy can be tempting to prioritize over inflation. In late 2023, Federal Reserve Chairman Jerome Powell hinted at cutting rates before reaching the 2% inflation target, prompting the market to quickly re-price to seven rate cuts over 2024.
However, the economy has not required Fed intervention, and rising inflation in the first three months of 2024 made rate cuts difficult to justify. The second quarter continued to surprise investors and markets. A weak April gave way to a mediocre May and a strong June in both equity and fixed income markets. The “Sell in May and Go Away” mantra seems forgotten for the moment. Lackluster economic data coupled with better than anticipated inflationary data in June, has brought the market to once again start pricing in rate cuts.
The Citi Economic Surprise Index (Chart 1) serves as a barometer for how economic data releases stack up to expectations. A positive number indicates expectations are lower than the reality of the economic data being released, hinting at a need for expectations to reset higher. A negative number signifies data is falling short of expectations, suggesting overly optimistic expectations may need to be dialed back to match reality, which can sometimes be a painful adjustment for markets.

So far, the data in 2024 has been disappointing, reaching levels reminiscent of two years ago. Interestingly, the markets are currently taking this unfavorable news as a positive sign, with the belief that it could give the Fed cover to cut rates. However, there may be a tipping point in the future where the accumulation of underwhelming data becomes concerning, steering the market to become fearful of a potential impending recession. Leading indicators we track confirm economic activity is weakening quickly. We suspect this is part of the reason treasuries rallied strongly in June. Yet, the equity market does not seem to share this apprehension.
Government spending at all levels has played an underappreciated role in GDP, employment, and wage growth over the past year and a half. As of March 2024, Federally, this spending, funded by borrowing, has contributed to a U.S. budget deficit of approximately -6% of GDP. This is exceptionally high by historical standards, particularly during economic expansions and low unemployment. An economic slowdown could widen the deficit as government revenues, reliant on income and corporate taxes, decline and unemployment payments rise.
Treasury sales bridge the gap between government revenues and expenditures. As national debt expands, so does the debt servicing cost. Interest payments are the fastest-growing segment of the budget and became the third largest U.S. outlay category through April 2024, surpassing National Defense.[1] This spending poses a formidable challenge for the Fed to achieve price stability while maintaining financial stability. The mounting pressure of demographic shifts on Social Security and Medicare spending amplifies deficit concerns.
Debt prioritizes present consumption while exacting a toll on future consumption. High debt balances and borrowing that is no longer free can encroach on present and future spending. This growing, non-discretionary portion of consumer, corporate, or government budgets is money that can no longer be spent. This makes it more challenging for governments to implement fiscal stimulus during a crisis or bolster military forces if geopolitical conflicts escalate. It also erodes the buffer available to withstand periods of softer economic growth for corporations and consumers.
Consumer debt, especially credit card debt, is swelling with higher interest rates and credit usage is extremely high. A larger share of consumers' income funneled into debt servicing diminishes the capacity for spending elsewhere, casting a shadow over future GDP growth. Higher borrowing costs inflate the actual purchase price. A 1983 revision to the Consumer Price Index removed interest expenses from the cost-of-living calculations. Using this formula, inflation remains at levels not seen since the early 1980’s.[2]
Rising unemployment could exacerbate the already burdensome debt servicing costs for individuals. The subsequent reduction in consumer spending could spill over to the business sector, suppressing sales growth for companies, some with their own debt challenges. In a slowing economy interest expenses loom ominously, exacerbating the impact of burgeoning debt. Leverage can rapidly escalate a situation, potentially posing a threat to the economy, currency, health care system, and national security.
We believe the convergence of slowing demographic growth, deglobalization, and the massive accumulation of debt on balance sheets may result in a further slowing of future potential GDP growth, a trend that began over a decade ago. Lower potential GDP growth undermines the country’s ability to grow its way out of the debt problem. It also may mean less growth is required to stoke inflation, potentially heightening volatility, and the frequency of central bank interventions, which could shorten cycles.
Higher rates benefit lenders and savers at the expense of net borrowers. In the U.S., a sizable portion of debt is fixed rate meaning the impact of higher rates on existing borrowers is felt when debt needs to be rolled over. The massive pandemic borrowing spree filled balance sheets globally with suffocating levels of shorter-term debt. We are now in the early innings of a massive debt maturity wall and rates are no longer near-zero. This will flood the market with a large supply of bonds which may raise the yield investors demand to lend, creating a negative feedback loop. Furthermore, the Fed’s quantitative tightening campaign keeps the most price insensitive buyer on the sidelines at the same time foreign buyers are also pulling back.
The onus is now on price sensitive private investors to fund the government’s growing financing needs. The question is whether the market can or will absorb such a large supply of bonds. So far, Treasury auction results have been mixed, but demand looks healthy for corporate bonds. An increase in Treasury yields likely raises borrowing costs for consumers, municipalities, corporations, and other governments. The commercial real estate market carries heightened risk as it moves through the middle of its maturity wall at depressed property valuations. Even a small portion of loans defaulting could result in large charge-offs and potential regional bank failures which could spill over into other areas of the economy and markets. [3]
Near-zero interest rates enticed governments, companies, and consumers to go on a debt-fueled spending binge with little consequence. Low rates inflated valuations in public and private markets and investors stretched risk tolerances for returns, a strategy which worked in the ultra-accommodative world that remained in place too long.
We believe the era of falling bond yields over the past forty years has reached its end and we are unlikely to see rates fall back to near-zero with any permanence. In this era of higher interest rates, the landscape is significantly different. The notion that economic issues can be solved with government borrowing becomes less feasible when borrowing is no longer free. There is now an opportunity cost to borrowing and the benefits need to outweigh the costs. Many believe the government debt bill will never come due. They may be right. But, at higher interest rates the math becomes more difficult to digest.
Warren Buffett's quote, “Only when the tide goes out do you learn who has been swimming naked,” aptly describes the current environment. Until the tide goes out it is not always obvious who is overextended. The real cause of capital loss is not the panic itself, but the actions taken in the years leading up to the pain. Corporate bankruptcies are increasing, and consumer delinquencies are rising quickly even while the economy remains healthy. We could be in for an Economics 101 lesson—There is No Free Lunch. Markets are not priced for this.
We introduced this chart last year and we think it is still extremely important. The three-month Treasury yield is our risk-free rate. We believe very few of the risks outlined in this letter are priced into the S&P 500, keeping us extremely cautious on the index and persistently patient while getting paid over 5.4% (annualized) in short-term treasuries. The US equity market today is trading at a higher valuation than the risk-free alternative of short-term treasuries. The equity risk premium measures the excess return investors demand for investing in the stock market beyond the risk-free rate and it is NEGATIVE today (gray line below the black line in Chart 2).

Investors own stocks because they expect a higher return than a risk-free government bond to offset the additional risk being taken. This market dislocation defies logic, especially at a time when risks are building, earnings expectations are optimistic, and tailwinds are turning into headwinds. Market dislocations can remain for periods of time but tend to prove unsustainable in the long term. Momentum works until it does not. When it stops working, get out of the way.
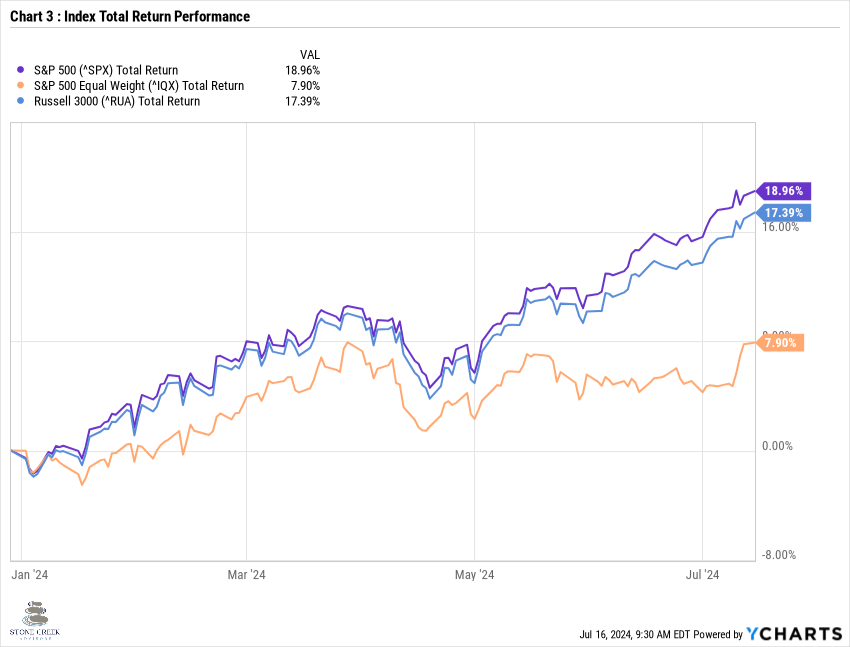
The S&P 500 is market cap weighted, creating a bias towards the largest names by market capitalization. The equal weighted index removes this largest capitalization bias and weights every stock in the index the same. When market leadership is very narrow in the largest names the S&P 500 will outperform, when performance is broader the equal-weighted index should perform better. The market performance year-to-date has been strong on both a headline and equal-weighted basis. However, the strong performance by the largest capitalization companies has been exceptional, driving a massive wedge between the headline and equal-weighted index performance (Chart 3).
The market is expensive, and while a large portion of the lofty valuations are attributable to a narrow group of stocks, equal weighting the index shows that it is not just the “Magnificent 7” making the market expensive. The capitalization weighted S&P 500 is trading at over 26x its last-twelve-months earnings, well above the average of 18.7x since 2001. However, the equal weighted index is also trading well above its historical average at over 19x today, while the average since 2009 has been 17.2 (Chart 4). We are seeing correlations breaking down among individual stocks. There are large deviations between valuations of growth stocks versus value stocks and small capitalization versus large capitalization, but correlations have decreased within some sectors. Areas of the market are becoming more attractively priced which could create potential buying opportunities.

A new era of prolonged higher rates is likely to change the investment landscape. Prudence and financial stewardship will be crucial, and investors will need to navigate the shifting market currents with judiciousness and caution. The possibility for shorter cycles could render traditional buy-and-hold investing less effective. Investors, savers, and borrowers need to re-adapt to an environment with inflation and higher interest rates, where money is no longer free.
As always, if you have any questions please reach out.
Kasey
One Seven (“One Seven”) is a registered investment adviser with the U.S. Securities and Exchange Commission (SEC). Registration with the SEC does not imply a certain level of skill or training. Services are provided under the name Stone Creek Advisors, LLC, a DBA of One Seven. Investment products are not FDIC insured, offer no bank guarantee, and may lose value.
[1] https://www.fiscal.treasury.gov/files/reports-statements/mts/mts0424.pdf
[2] The Cost of Money is Part of the Cost of Living: New Evidence on the Consumer Sentiment Anomaly”. Marijn A. Bolhuis, Judd N. L. Cramer, Karl Oskar Schulz, and Lawrence H. Summers. NBER Working Paper No. 32163. February 2024. JEL No. D14, E30, E31, E43, E52, G51, R31 < https://www.nber.org/system/files/working_papers/w32163/w32163.pdf>.
[3] https://www.nber.org/papers/w31970